Sometimes, the size of a data is so large that it cannot be understood easily. To overcome this problem, we use “Charts”. Chart is a form of representing figures and values in the form of diagrams. These diagrams can be in the form of a Column, line, pie, bar, area charts etc. Therefore, understanding the figures becomes simple. Charts are mainly used in excel documents as the values are calculated in spreadsheets.
Recommended: – How to insert An Excel sheet into word
In this article, we’ll follow certain steps on how to edit and insert a chart in Microsoft Word 2016:
Step 1:
Type “word 2016” in the Windows Search Bar located next to the Start icon. Click on the first option provided.
Step 2:
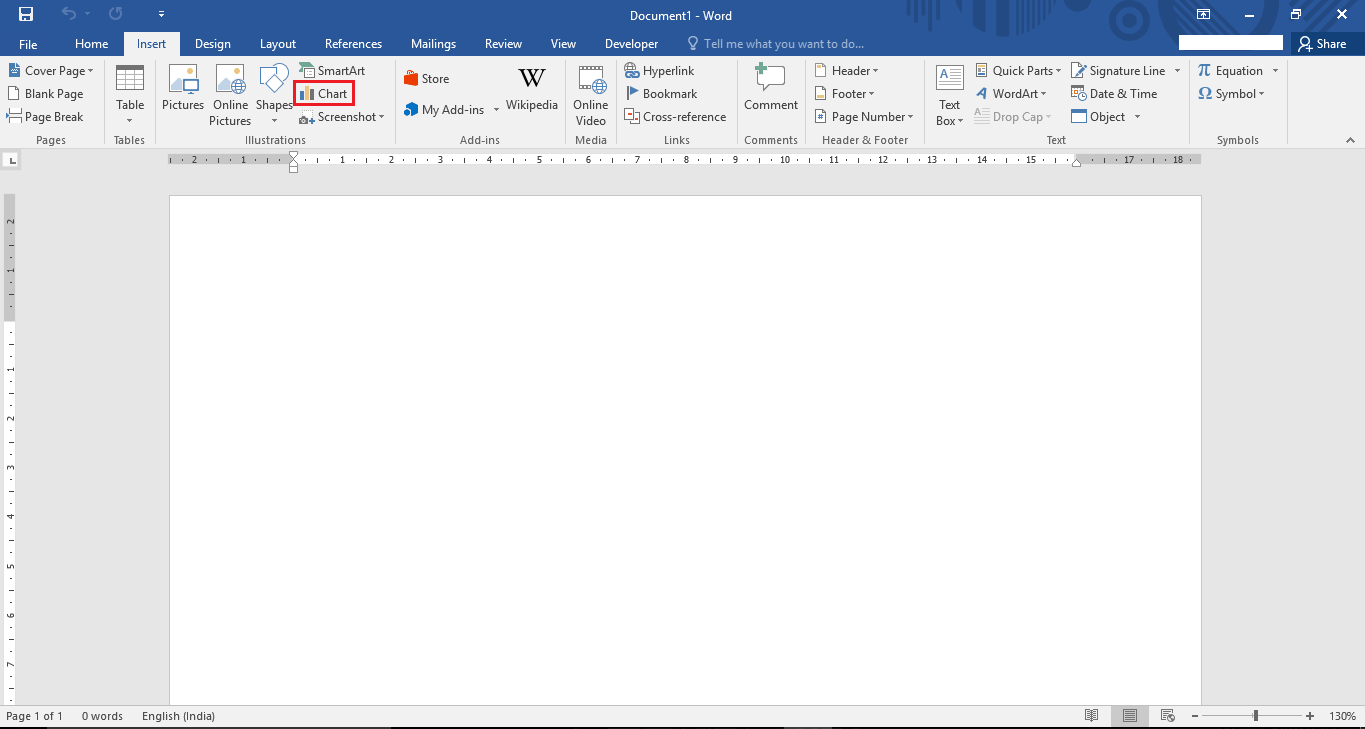
Click on “Insert” tab located at the top left corner of the “Word” window. After clicking, a ribbon toolbar will appear providing numerous options like paging options, tables, illustrations, symbols etc.

In the illustration section, click on “Chart”.
Step 3:
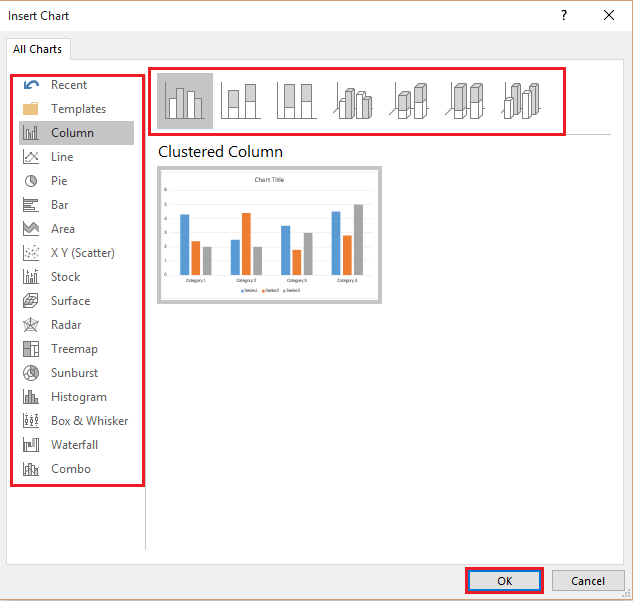
The categories for selecting a chart can be observed in the left sub menus of the “Insert Chart” window. You can select any type of chart you wish to include in your word document.
The top section of the window consists of different sub-categories of the selected chart. Choose the most appropriate one by manoeuvring your cursor to the sub-categories & clicking onto it.
After you’ve selected your chart and its sub-category, click on “OK” to continue editing the chart.

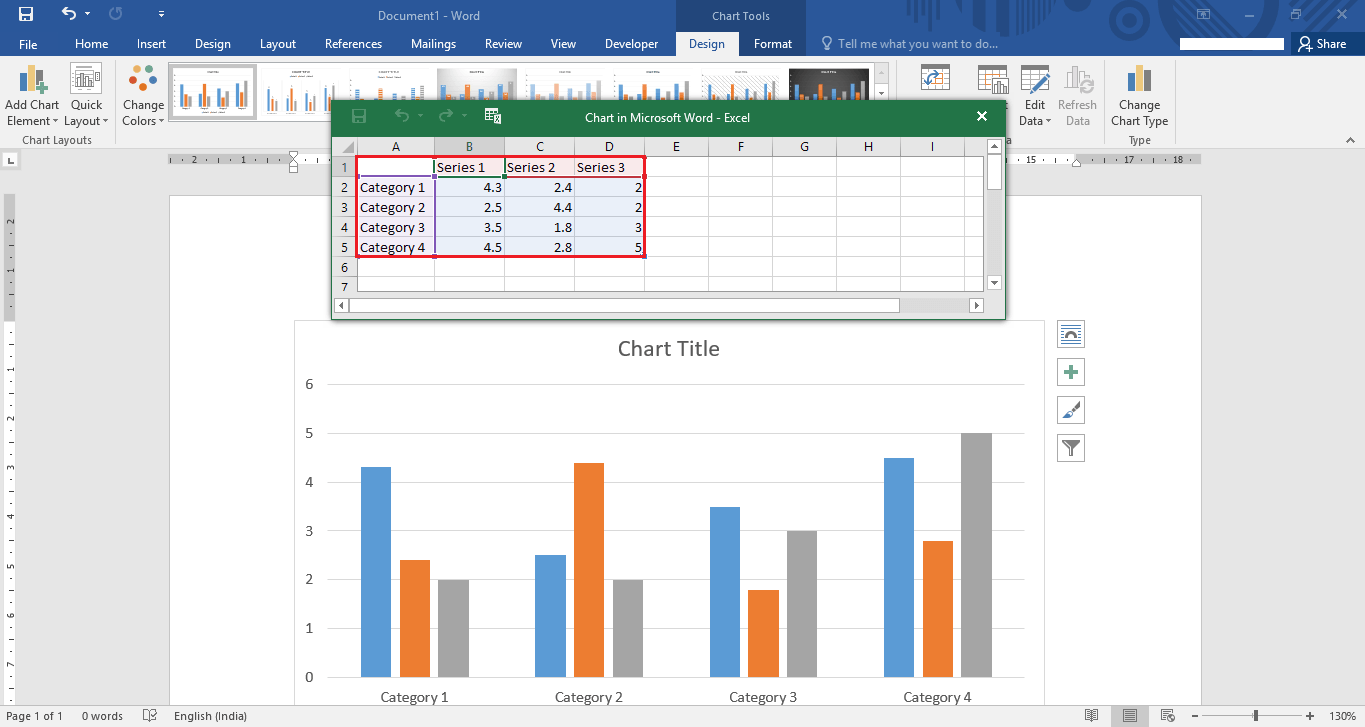
Now, the selected chart will display on your word document with its pre-defined values in an excel page. Here, we’ll change the values of the excel sheet & that would reflect on the selected chart.

Step 4:
To edit the values, click on any cell and type the value. Your entered values will be displayed on the chart.
Here, we’ve defined a column chart for a “mobile company” showing the quarterly results i.e. Q1, Q2, Q3 & Q4 in terms of its Market Share, Rise and Growth rate respectively.

Step 5:
For editing the chart name, right click on the “Chart Title” and click on “Edit Text”.
Enter a desired chart name. For instance, we’ve entered “mobile company”.

Step 6:
You can change the size of the chart by making it large or small. To do this, click & drag on the “circle” icon provided at all sides of the chart. Dragging the icon towards the chart will make the chart small and dragging away will make it appear larger.

Step 7:
If you need different positioning of text and images, you can try out the “Layout options”. Layout options consists of features like positioning, text wrapping and size of images.
To use this option, click on the “arc” icon located at the right side of the image.

You can choose various layout options from the icons. If you wish to have a different layout from the pre-defined layouts, click on the “See more” button.

Step 8:
The “see more” button opens the layout properties window. You can create a custom layout having different horizontal and vertical alignments.
After defining all the alignments and other options, click on “OK” to complete the process.

Step 9:
You can also format the chart area by changing its color, transparency, outline & filling of texts. To use this option, double click on the chart and edit the options provided in the right section of the word page.

Step 10:
You may try out the different charts of the same chart type. To use this option, check out the other design column charts provided at the top section of the word page.

For instance, we’ve selected a different column chart shown by the arrow in the given screenshot:
Step 11:
If you wish to change your current chart, repeat step 3 & choose another chart.
For instance, we’ve chosen a “Pie” chart. For selecting a Pie chart, click on “Pie” provided at the left section of the “Insert Chart” window. Select a sub-category of the Pie chart & click on “OK”.

Now, the Pie chart will be displayed on the word page & you can edit various options of the Pie chart as the same way as you did for the column chart.
